Tips & Tricks
2022 Sep 29 11 mins read
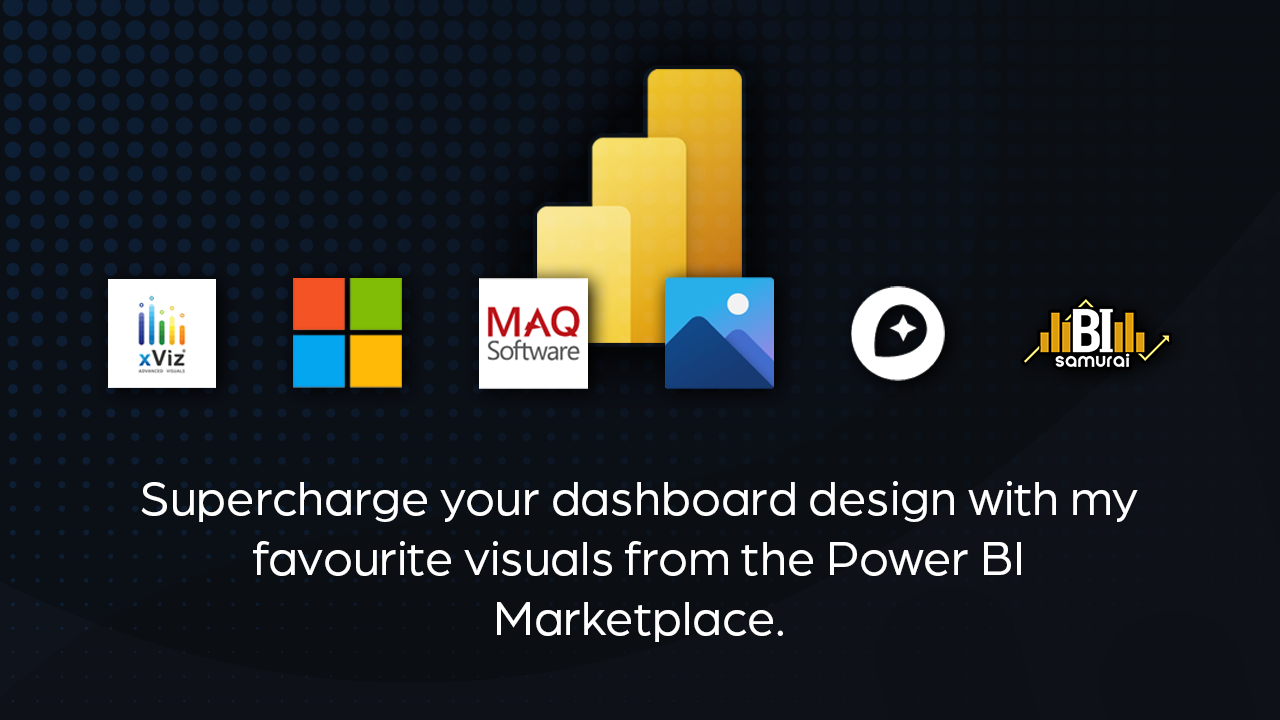
Take a look at our favourite visuals form the Power BI marketplace, including HTML, mapping and Gantt charting solutions for your data analaytics.
2022 Aug 29 7 mins read
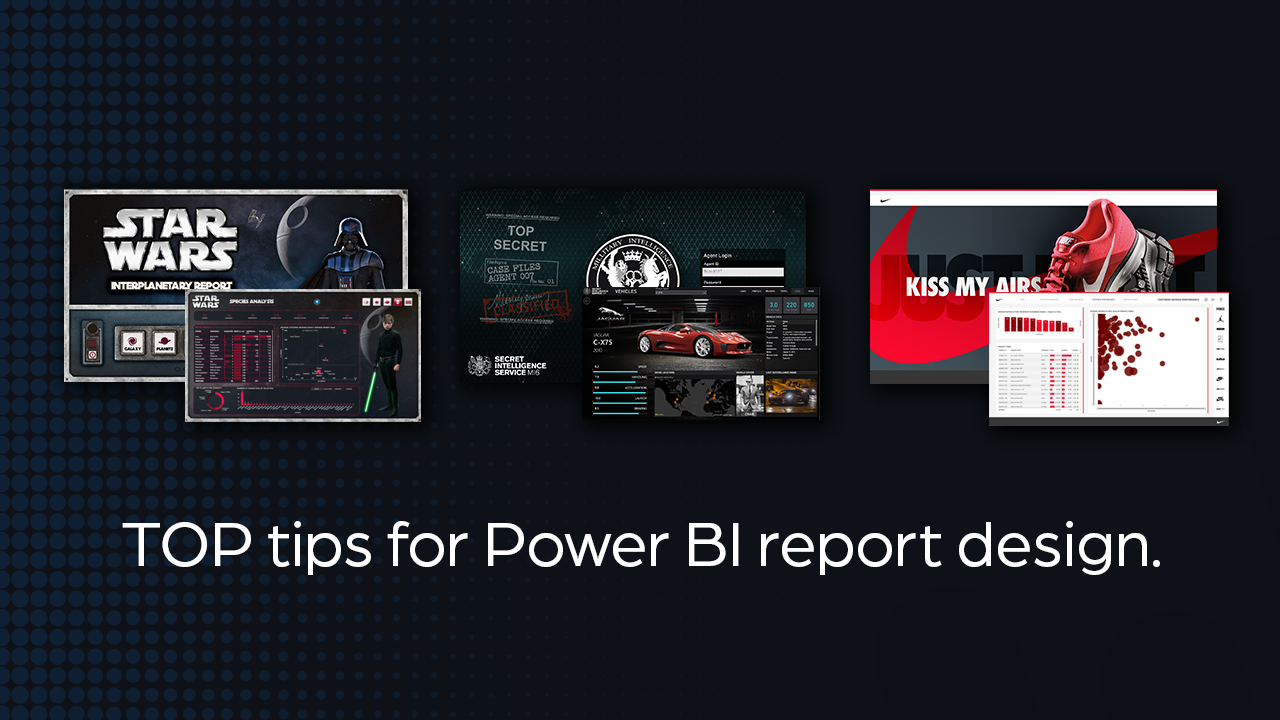
See our top tips for Power BI report design, and the processes we go through to make aesthetic business intelligence reports.
Latest posts
2022 Sep 29 11 mins read
2022 Aug 29 7 mins read
Featured posts
2023 Nov 25 5 mins read